
Introduction
Running a quantitative research project is a complicated and fragmented process. A typical multi-market survey involves many people across different roles: consultants, research managers, designers, developers, scripters, translation agencies, and panel partners. It’s not unusual for more than ten people to be involved, working across different tools, systems, and timezones.
Weeks are spent setting up the project before it ever goes live: writing questionnaires, aligning on logic, preparing assets, building and scripting the survey, translating content, testing, fixing issues, and coordinating changes. Once launched, the study goes into fieldwork, where teams mainly focus on tracking progress and quotas. Once fieldwork is complete, the data is then cleaned, validated, and prepared before any analysis can begin. From setup to insight, the process spans multiple phases, tools, and handovers.
Formentera, a software to write questionnaires. It outputs a word document that still needs to be scripted and developed into a working survey using separate softwares.
The Challenges
Because the research process is spread across so many stages and systems, it operates in a largely waterfall way. Each phase depends on the previous one being “finished,” leaving little room to sense-check or iterate early. For example, when writing the survey, there is no real way to test or preview how it will actually feel as a conversation. Because of that issues are only identified much later, and any update will require re-scripting.
Because the research process is spread across so many stages and systems, it operates in a largely waterfall way. Each phase depends on the previous one being “finished,” leaving little room to sense-check or iterate early. For example, when writing the survey, there is no real way to test or preview how it will actually feel as a conversation. Because of that issues are only identified much later, and any update will require re-scripting.
Once fieldwork starts, visibility remains limited. Teams can see how many responses are coming in, but there is no way to assess data quality in real time. If data quality turns out to be poor (due to a mistake in setup or fieldwork) the only option is to go back into field. This adds time, cost, and uncertainty to an already complex process.
The (Unified) Solution
Taking inspiration from design thinking and agile methodologies, Lisa transforms the operational side of quantitative research as one iterative process rather than a series of disconnected steps. Instead of treating writing, setup, fieldwork, and analysis as separate phases handled by different tools, Lisa brings them together into a single workflow that evolves overtime.
Taking inspiration from design thinking and agile methodologies, Lisa transforms the operational side of quantitative research as one iterative process rather than a series of disconnected steps. Instead of treating writing, setup, fieldwork, and analysis as separate phases handled by different tools, Lisa brings them together into a single workflow that evolves overtime.
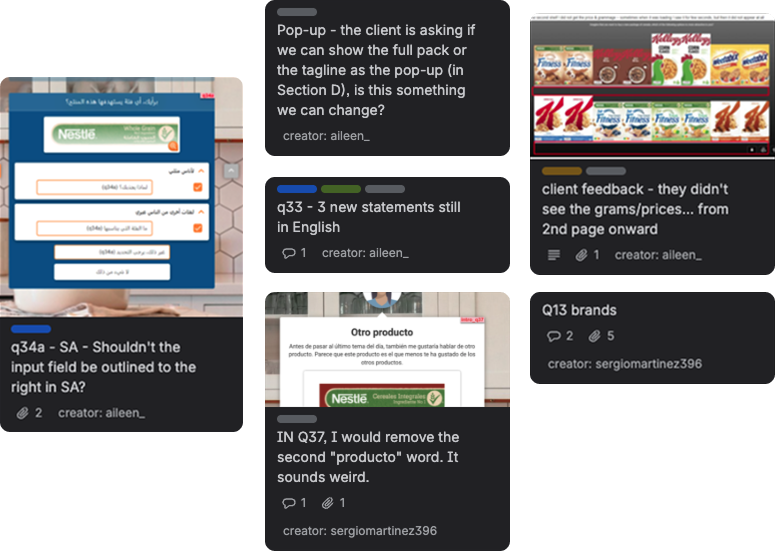
From the moment a project is created, it can be tested, previewed, and experienced as a real conversation, as it is being written. Researchers no longer have to wait for the staging link to understand how the conversation feels. Questions, logic, and flow can be tested at any stage, allowing issues to surface immediately, when they are easiest to fix. This new philosophy rethinks testing from a final checkpoint into an integral part of writing itself. What researchers learn while testing directly informs how questions are phrased, ordered, and refined. Writing and testing become a feedback loop, not a handover. As a result, surveys are no longer built, launched, and analyzed in isolation. They become living projects that can be observed, adjusted, and understood throughout their entire lifecycle.

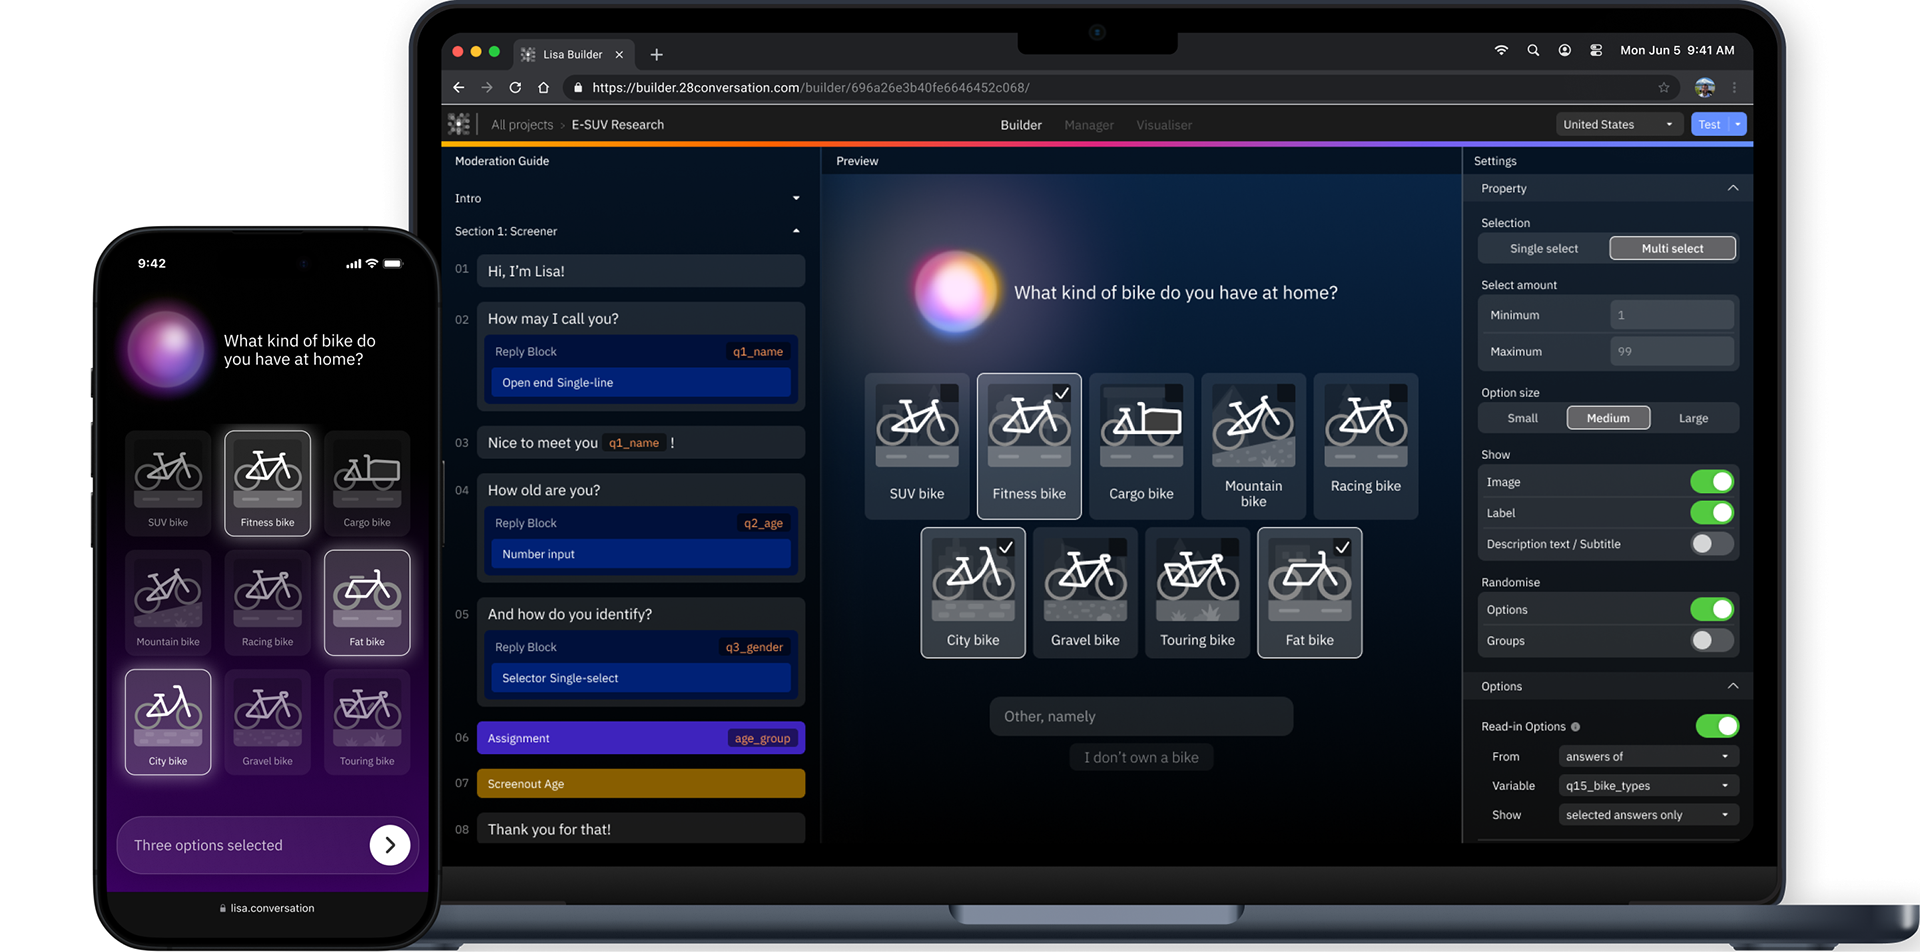
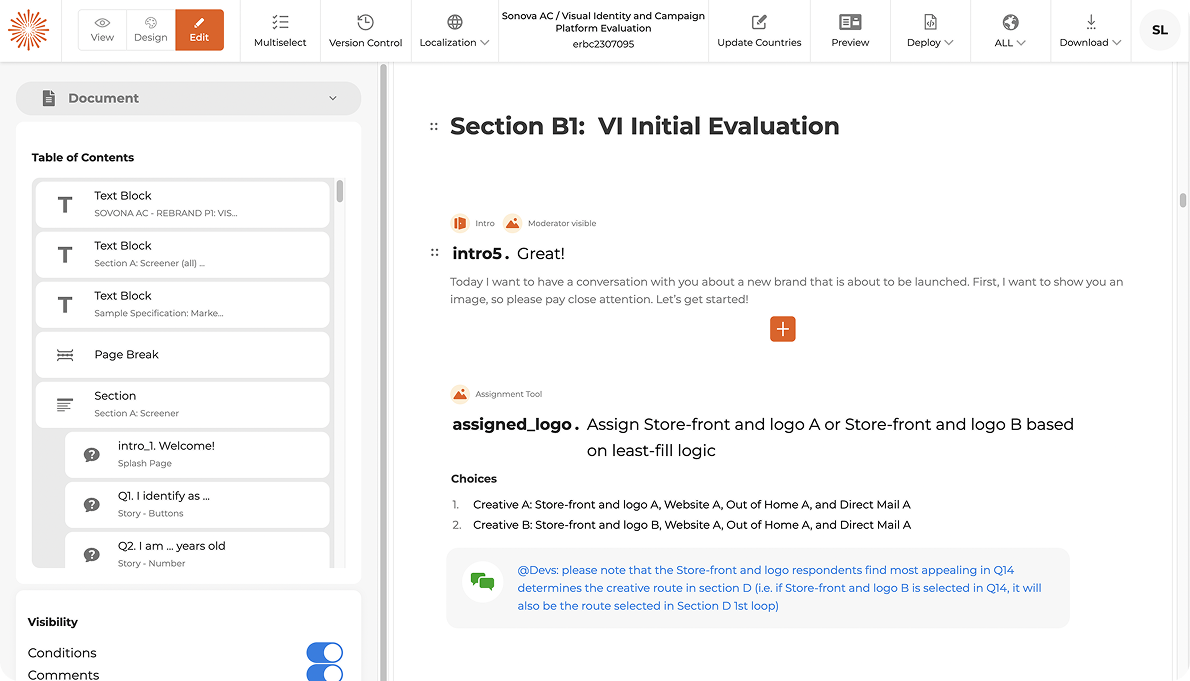
Project overview page
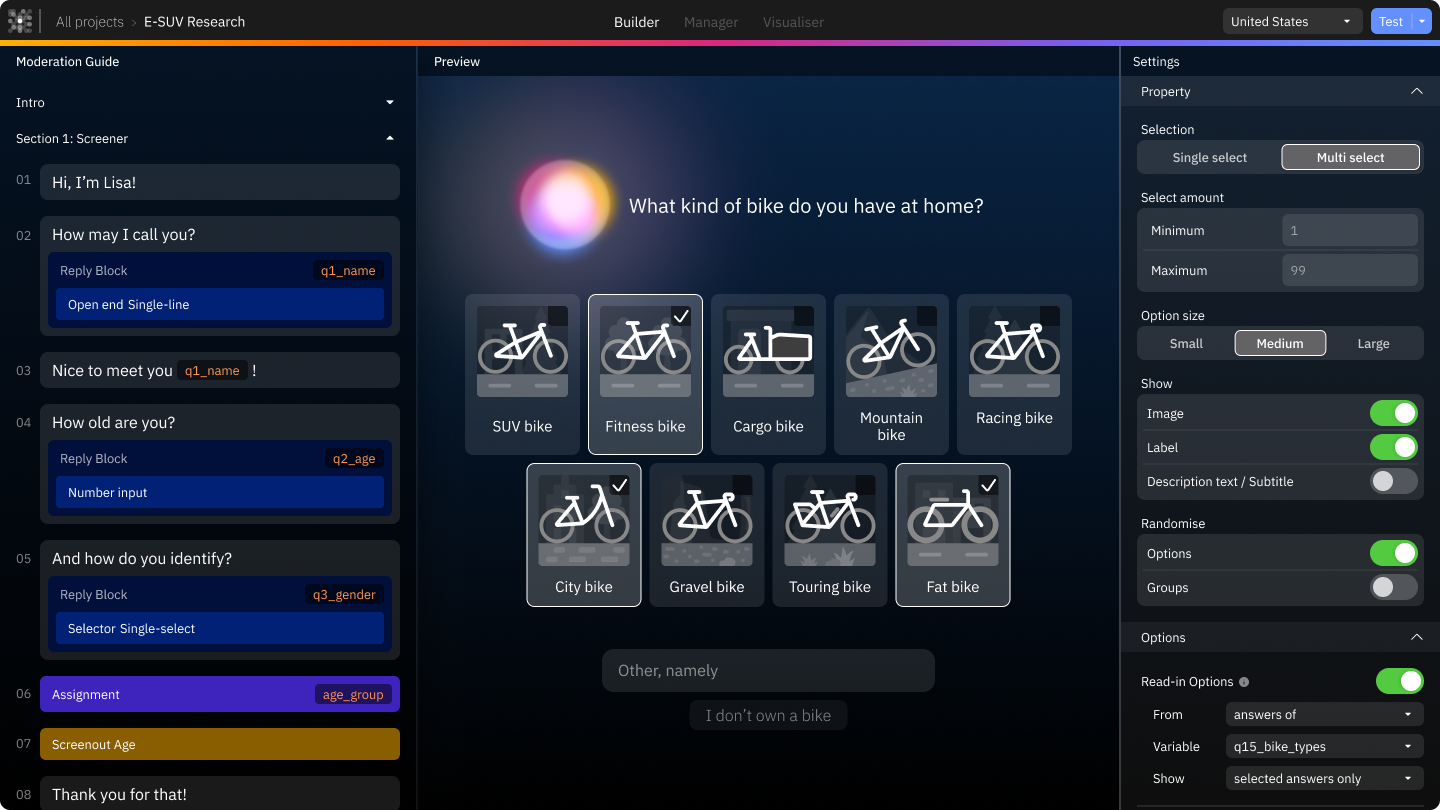
The builder features a three-panel layout: the left panel displays the moderation guide as a hierarchical tree, the middle shows a preview of the selected dialogue and the right contains the settings.
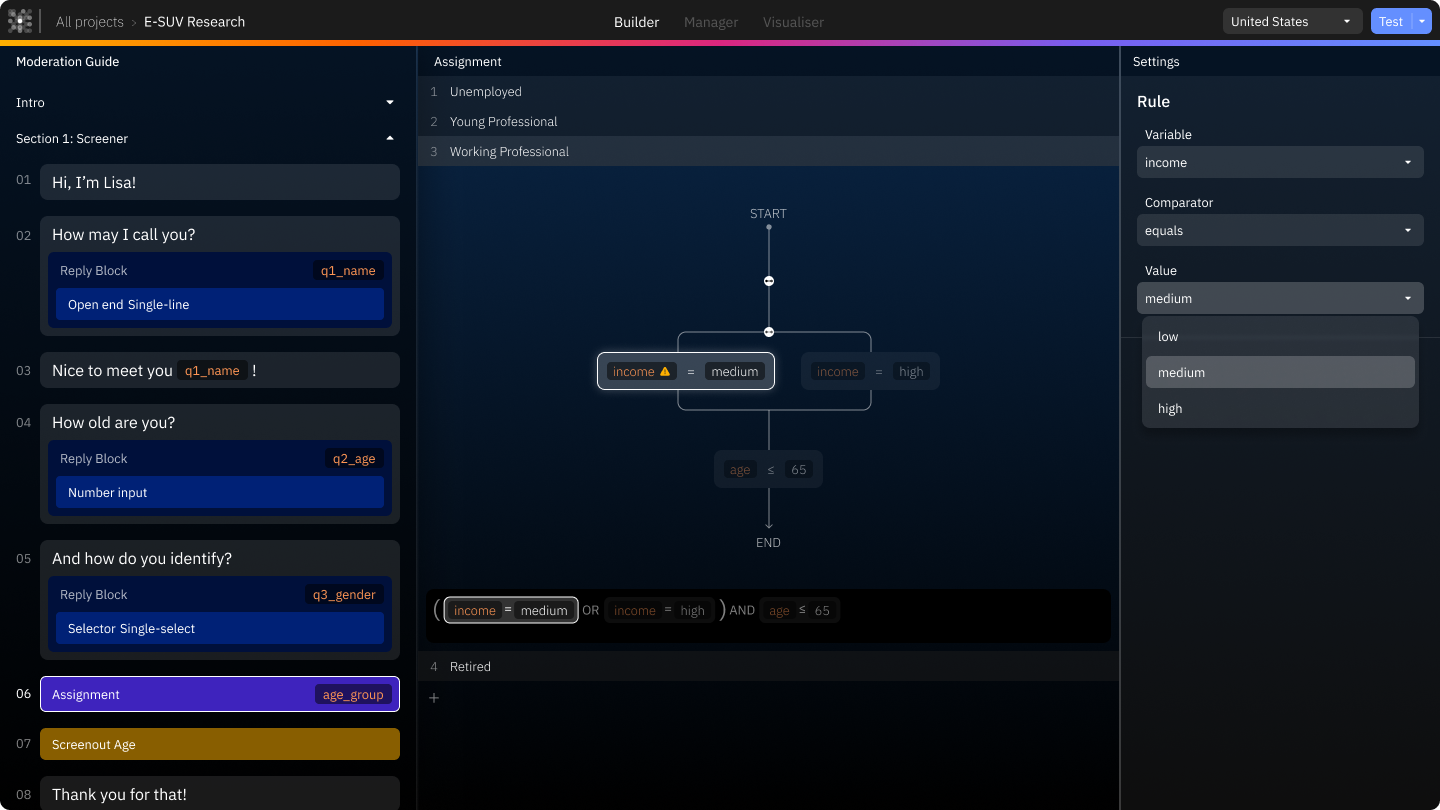
One innovative feature of the builder is the conditional logic builder which uses an intuitive design, allowing researchers to build, visualize and test their logic.
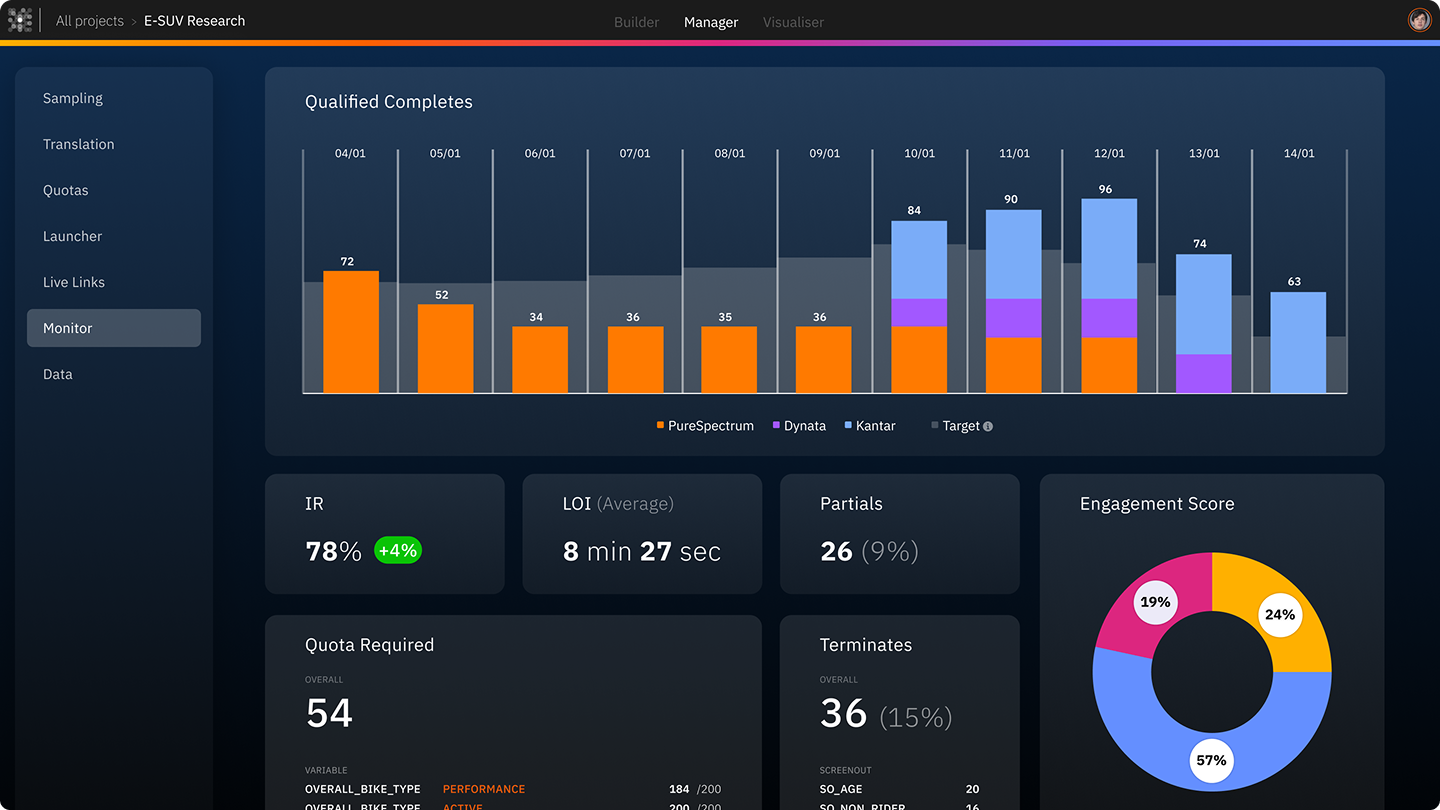
The manager page gives real-time view of fieldwork progress, combining response volume, sample sources, and key metrics.
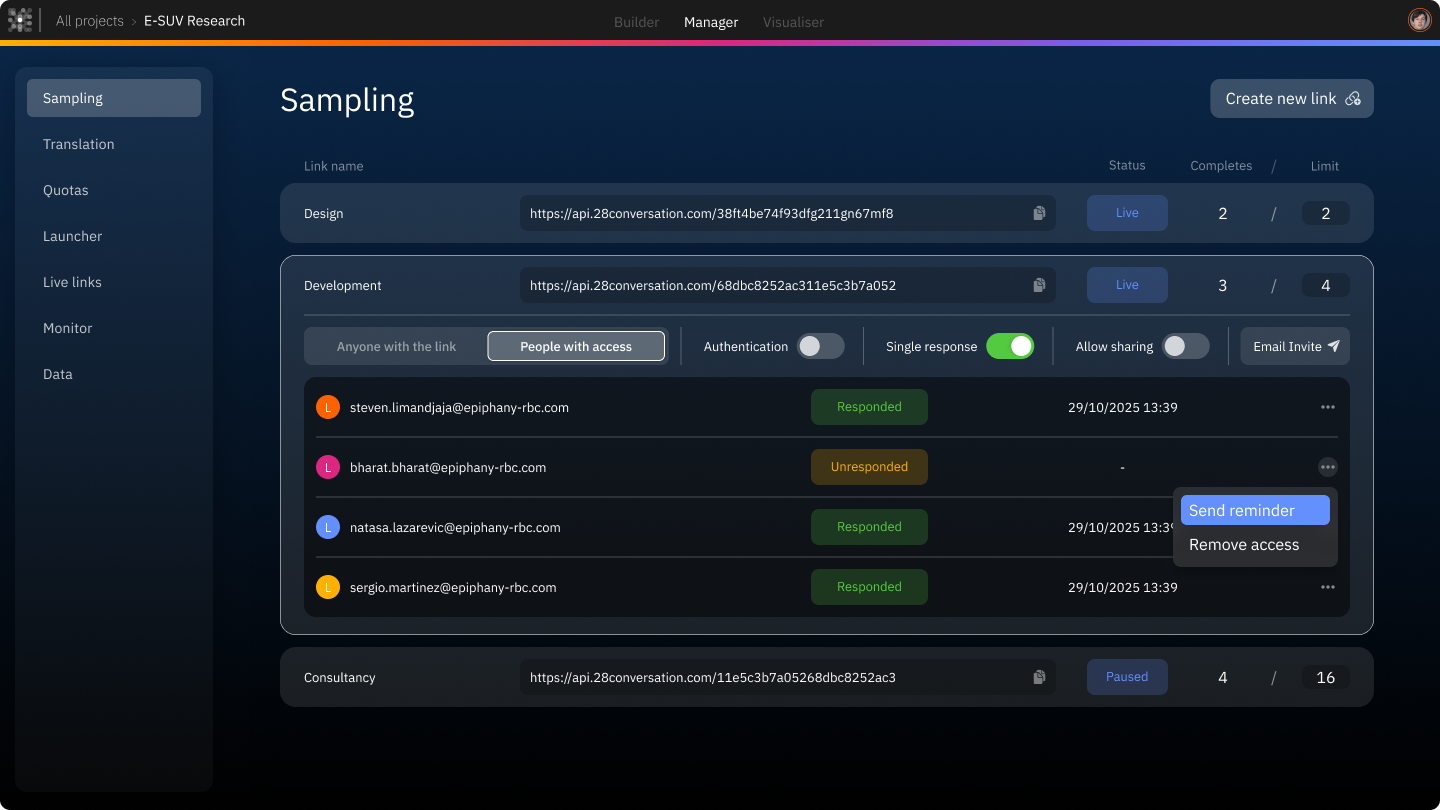
Researchers can choose how to source their respondents: by creating an email campaign, or through panel providers.
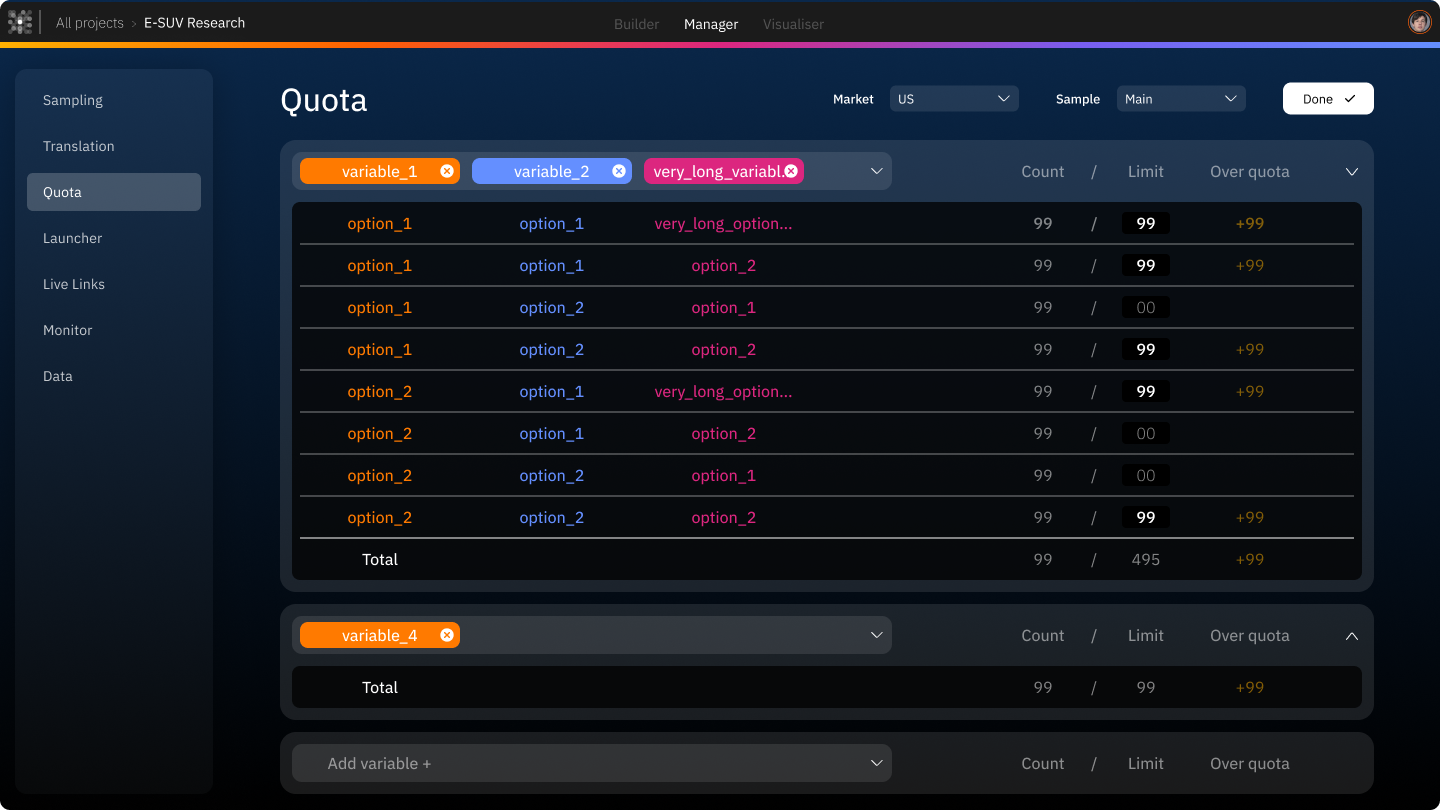
Quota management becomes much more transparent, as counts, limits, and over-quota responses are visible at all times and can be adjusted without stopping or rebuilding the study.
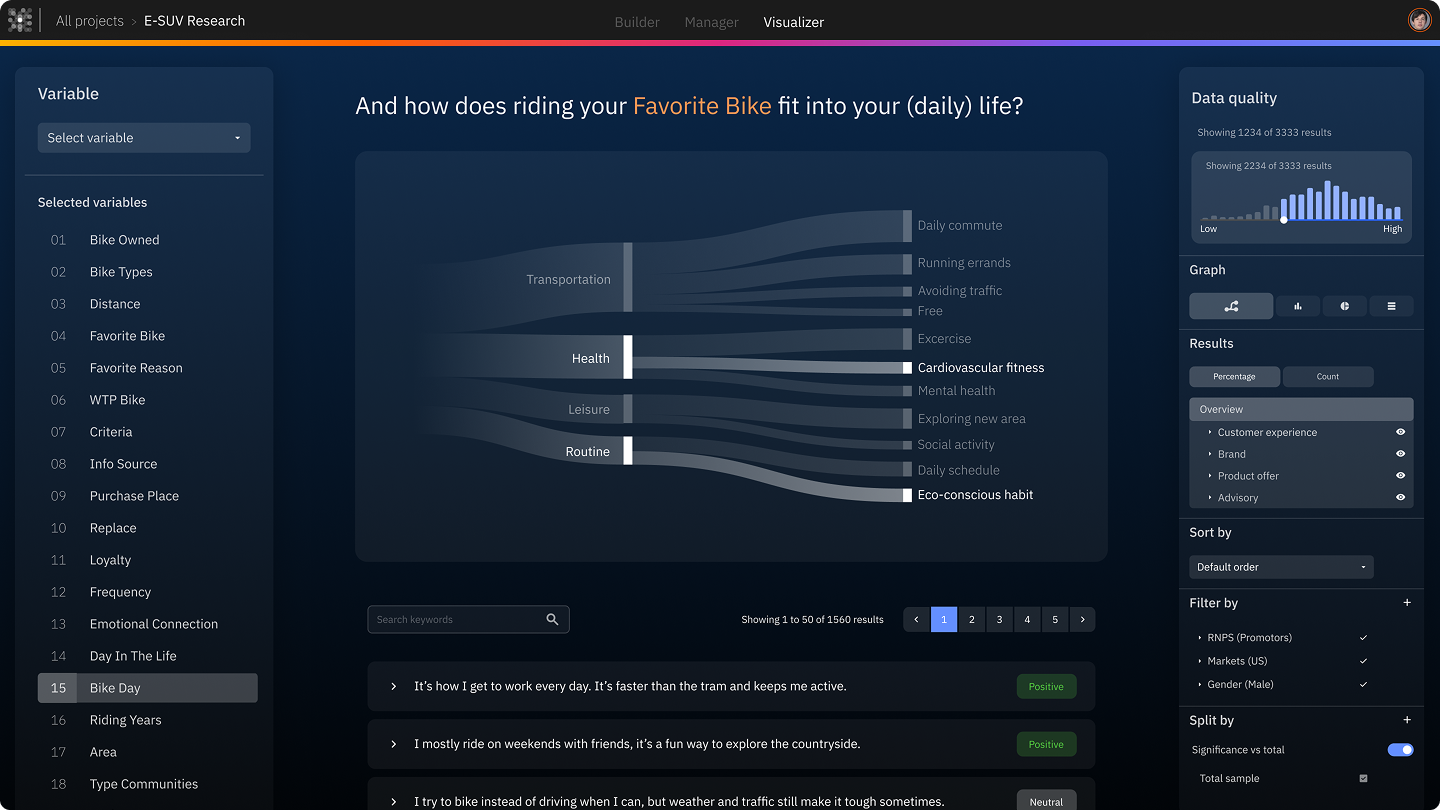
The visualizer allows researchers to explore results as they come in, turning analysis into a continuous process rather than a final step at the end of fieldwork.
The Impact
By reducing the number of tools and roles involved in a project, Lisa has a clear impact on both cost and speed. Expensive software licenses are no longer needed, leading to significant cost savings. At the same time, projects move much faster. What used to take two to four weeks can now be completed in days.
The way teams work also changes. One person can run a project from start to finish, without relying on scripters for custom styling or logic and external agencies for translation. With fewer handovers and less coordination, teams can run more projects in less time. Overall, productivity increases significantly, without adding more people or extra complexity.
The impact went beyond Epiphany itself. Lisa proved so effective that it became its own company: Twentyeight Conversation. Since then, more and more companies and consultancies outside of Epiphany have started migrating their research projects to Lisa, using it as their primary way to design and run quantitative research.
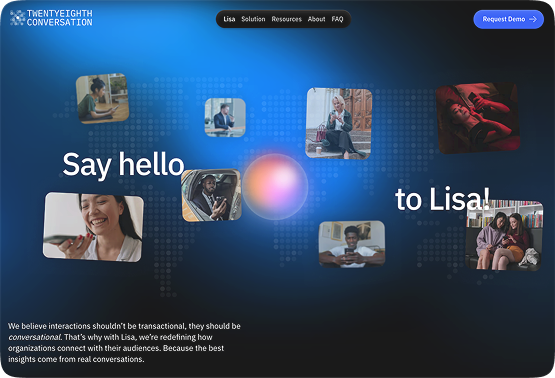
Website of Lisa (opens in new tab).
Continue reading ...
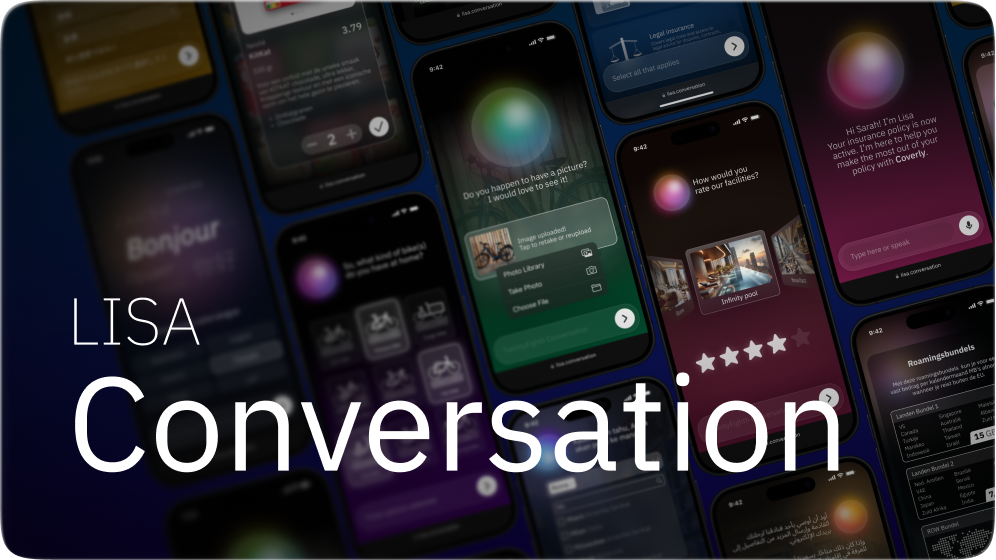
Curious how the conversation with Lisa actually feels?
Read more about Lisa: Conversation
Curious how the conversation with Lisa actually feels?
Read more about Lisa: Conversation